Debugging with STM32CubeIDE
In the previous post (Setting up the New STM32CubeIDE), we introduced how to install STM32CubeIDE on a Windows machine and import our reference project into the workspace. We successfully built the firmware for our B-L475E-IOT01A discovery platform. In this post, we are going to show you how to setup the GDB debugger, download the program (firmware) to the target and run/debug the program.
Debugger Setup
Under the top menu bar, there are three small icons which are used to start the debugger.
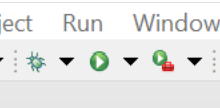
The leftmost icon is to start or configure the Debugger. The rightmost icon is to start or configure External Tools. There are a couple ways to launch the debugger and they are described in the following sections.
Built-in OpenOCD
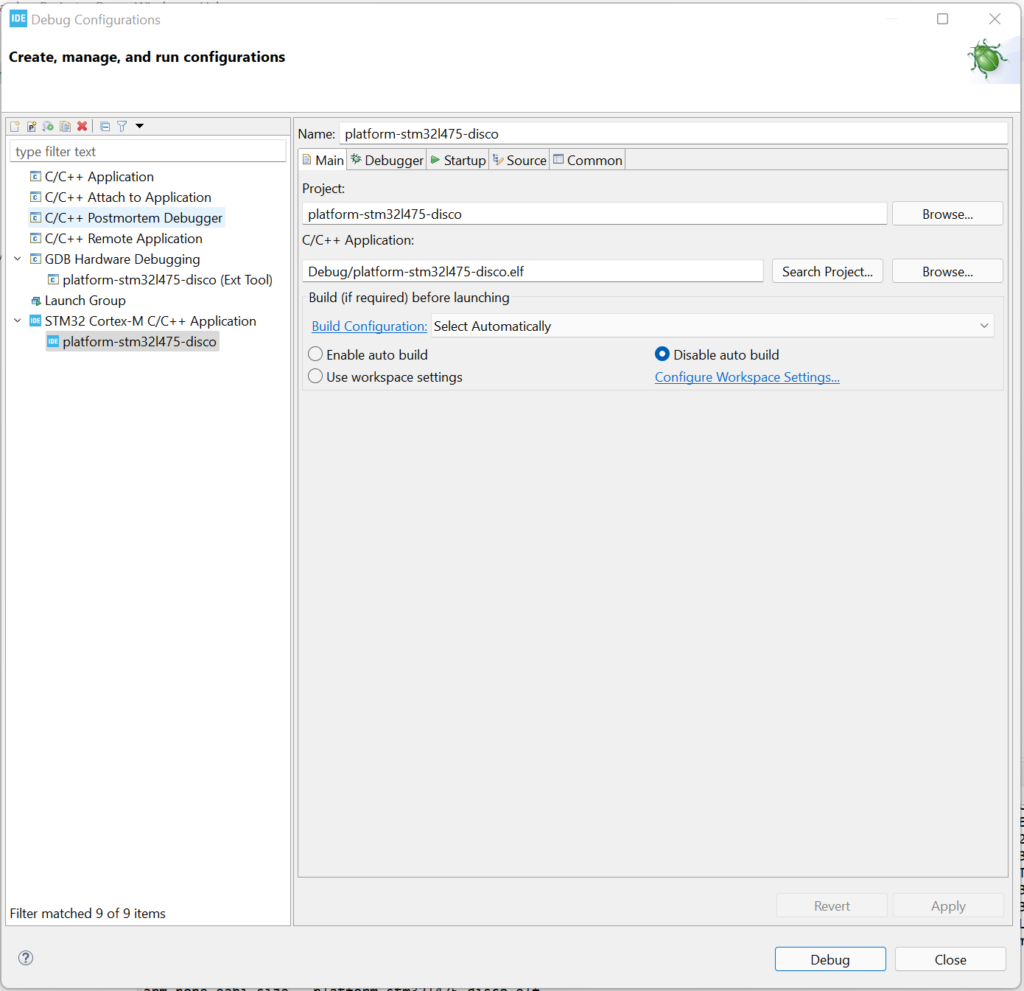
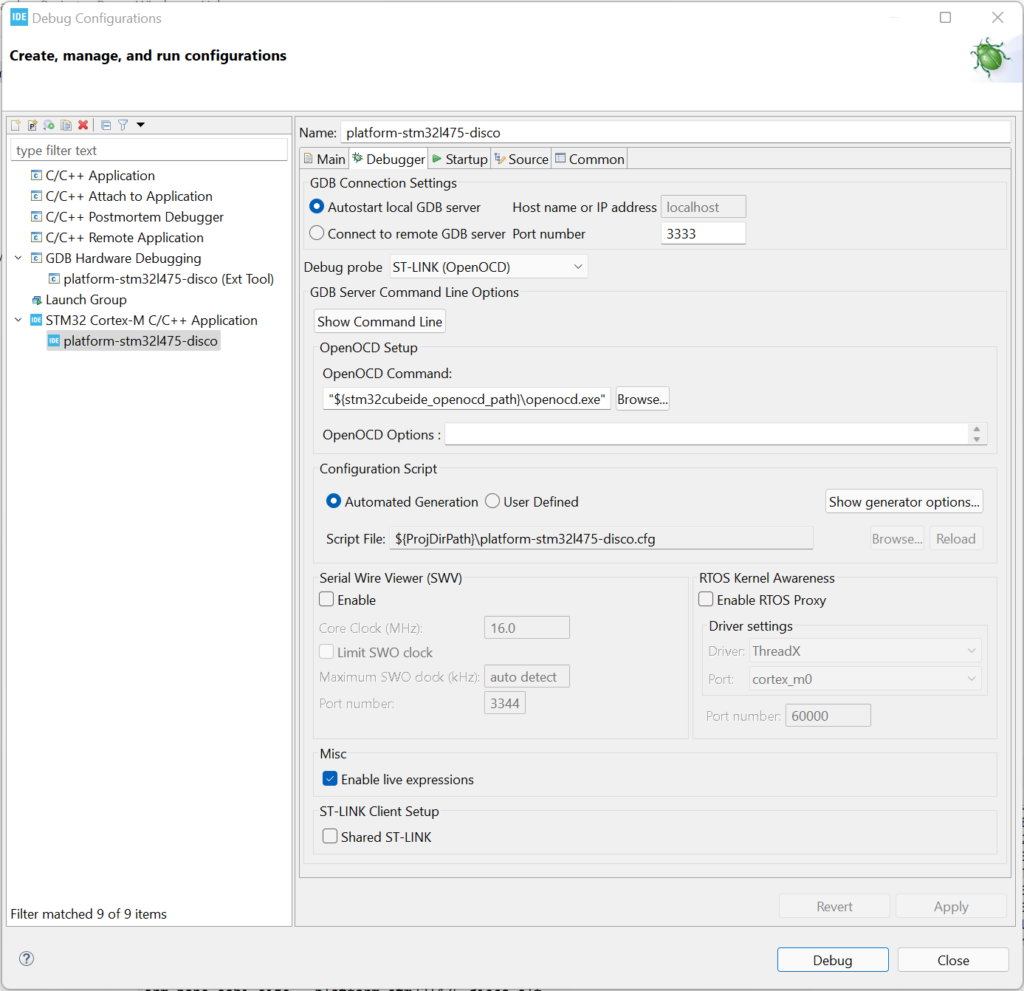
- Click the down arrow next to the Debugger icon to pull down a menu. Click the “Debug Configurations…” menu item.
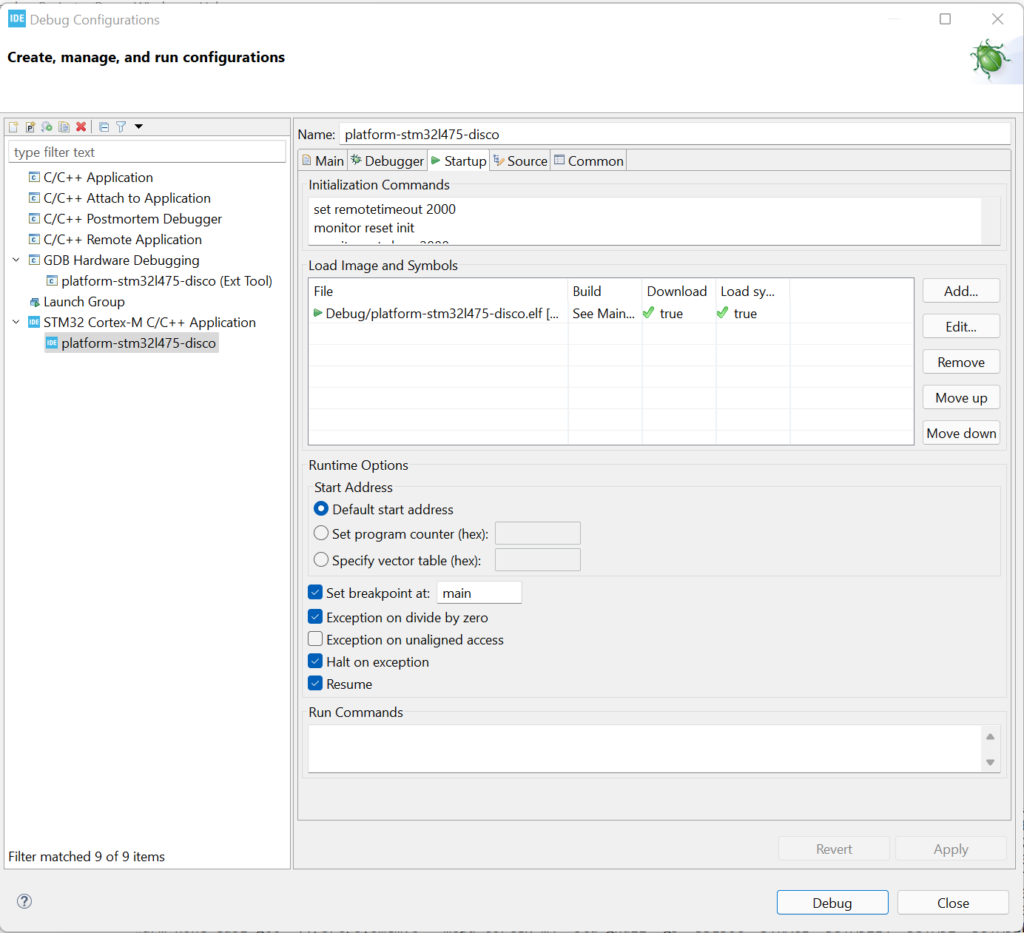
- Click STM32 Cortex-M C/C++ Application >platform-stm32l475-disco on the left side panel.
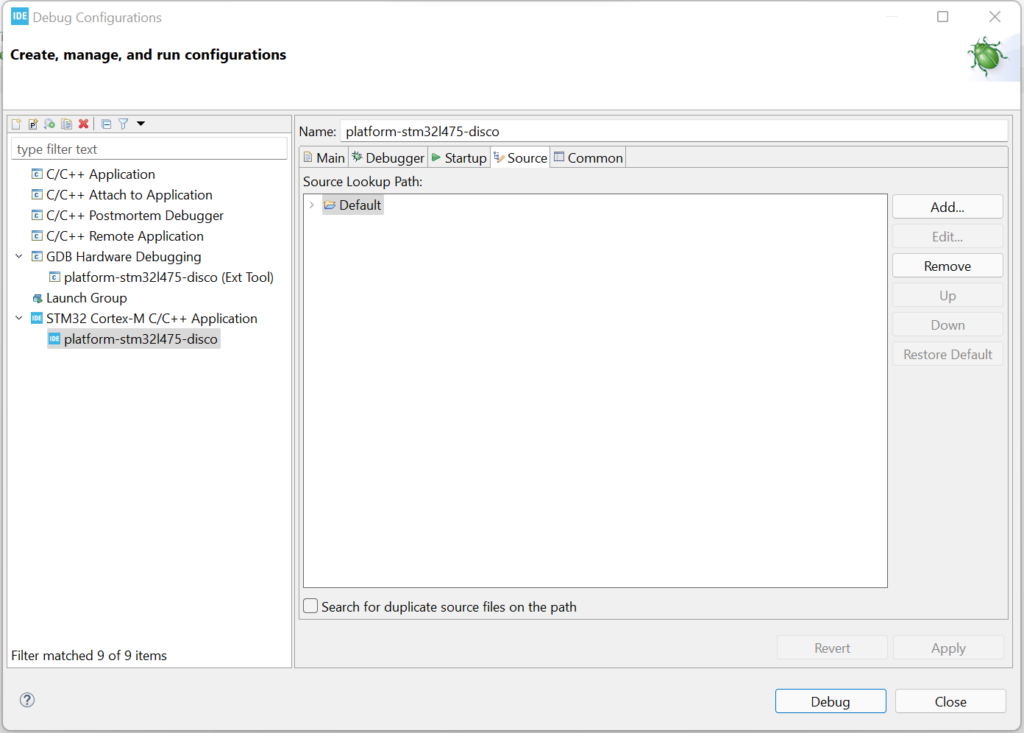
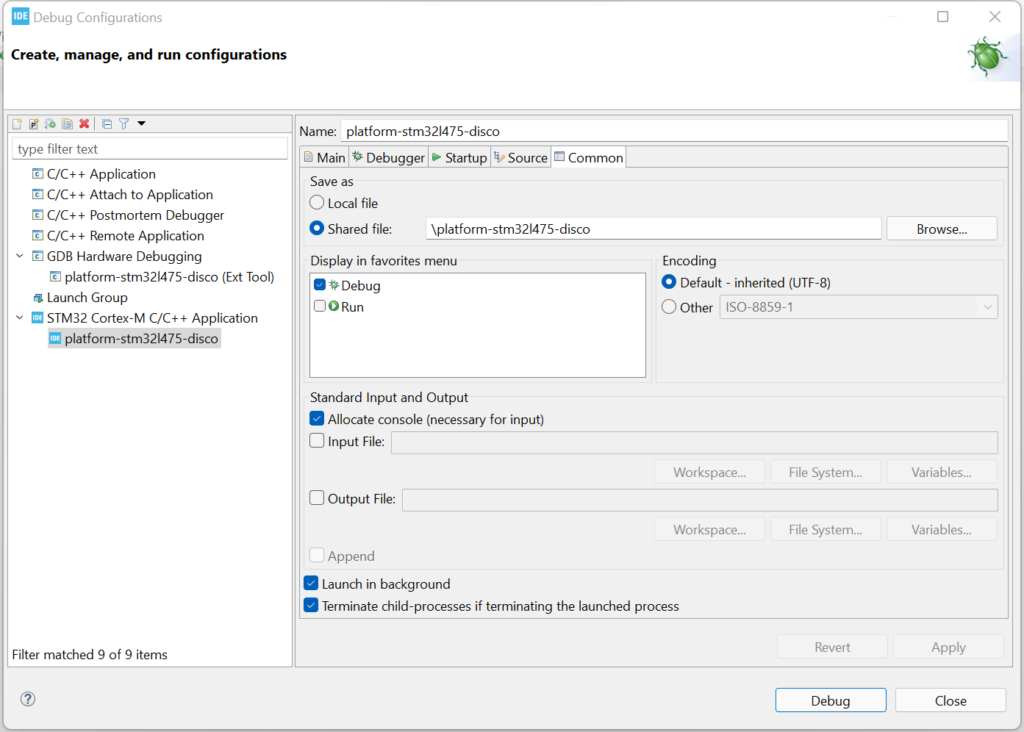
- The imported project should come with proper default settings. Review those settings with the following screenshots (one for each tab). Note the default Debug probe setting on the Debugger tab was set to “ST-LINK (ST-LINK GDB server)“. We have changed it to “ST-LINK (OpenOCD)“. Either one should work.
- Click the Debug button at the bottom-right corner to start debugging. Alternatively you may launch it via the favorite link named platform-stm32l475-disco at the top of the pull-down menu. It will take some time (<30s) to download and flash the program to the target. When it is completed successfully, you should see logs ending like these:
Info : accepting 'gdb' connection on tcp/3333
target halted due to debug-request, current mode: Thread
xPSR: 0x01000000 pc: 0x08066e28 msp: 0x20018000
Info : Unable to match requested speed 8000 kHz, using 4000 kHz
Info : Unable to match requested speed 8000 kHz, using 4000 kHz
target halted due to debug-request, current mode: Thread
xPSR: 0x01000000 pc: 0x08066e28 msp: 0x20018000
Info : Unable to match requested speed 8000 kHz, using 4000 kHz
Info : Unable to match requested speed 8000 kHz, using 4000 kHz
2000
target halted due to debug-request, current mode: Thread
xPSR: 0x01000000 pc: 0x08066e28 msp: 0x20018000
Info : Unable to match requested speed 8000 kHz, using 4000 kHz
Info : Unable to match requested speed 8000 kHz, using 4000 kHz
Info : Padding image section 0 at 0x08000194 with 12 bytes
target halted due to debug-request, current mode: Thread
xPSR: 0x01000000 pc: 0x08066e28 msp: 0x20018000
- This method is convenient since it launches OpenOCD automatically, but it may be slower since it needs to relaunch OpenOCD for each debug session.
External OpenOCD (Optional)
- Another way to launch a debug session is to start OpenOCD as an external tool. In order to do that, we need to first setup OpenOCD by clicking the down arrow next to the External Tools icon to pull down a menu. Click the “External Tools Configurations…” menu item.
- Create a new tool configuration under Program on the left side panel. Name this configuration OpenOCD STM32L4 Discovery. The key configurations are the path to the openocd.exe, path to the scripts folder and the specific board cfg file for our platform. It is assumed that you have OpenOCD installed previously. In the example below, OpenOCD has been installed under C:\Users\Public\Documents\Projects\openocd (There will be another post to show you how to install openocd and custom GNU toolchain).
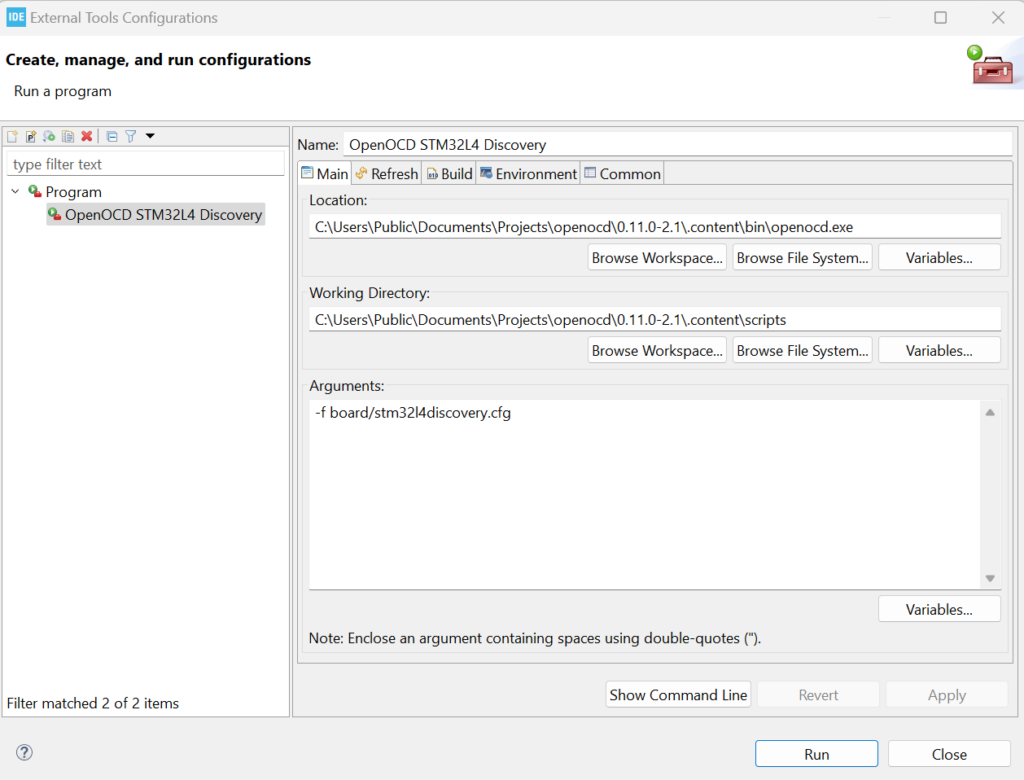
- Click the Run button at the bottom-right corner to start OpenOCD. Alternatively you may run it via the favorite link named OpenOCD STM32L4 Discovery at the top of the pull-down menu. If it is started successfully, the console shows these log messages:
Info : Listening on port 6666 for tcl connections
Info : Listening on port 4444 for telnet connections
Info : clock speed 500 kHz
Info : STLINK V2J39M27 (API v2) VID:PID 0483:374B
Info : Target voltage: 3.246592
Info : stm32l4x.cpu: Cortex-M4 r0p1 processor detected
Info : stm32l4x.cpu: target has 6 breakpoints, 4 watchpoints
Info : starting gdb server for stm32l4x.cpu on 3333
Info : Listening on port 3333 for gdb connections
- Now we go back to set up our debug configuration. Click the down arrow next to the Debugger icon to pull down a menu. Click the “Debug Configurations…” menu item.
- Click GDB Hardware Debugging >platform-stm32l475-disco (Ext Tool) on the left side panel. Review the default settings which are similar to those in the Built-in OpenOCD section above, except for the Debugger tab shown below.
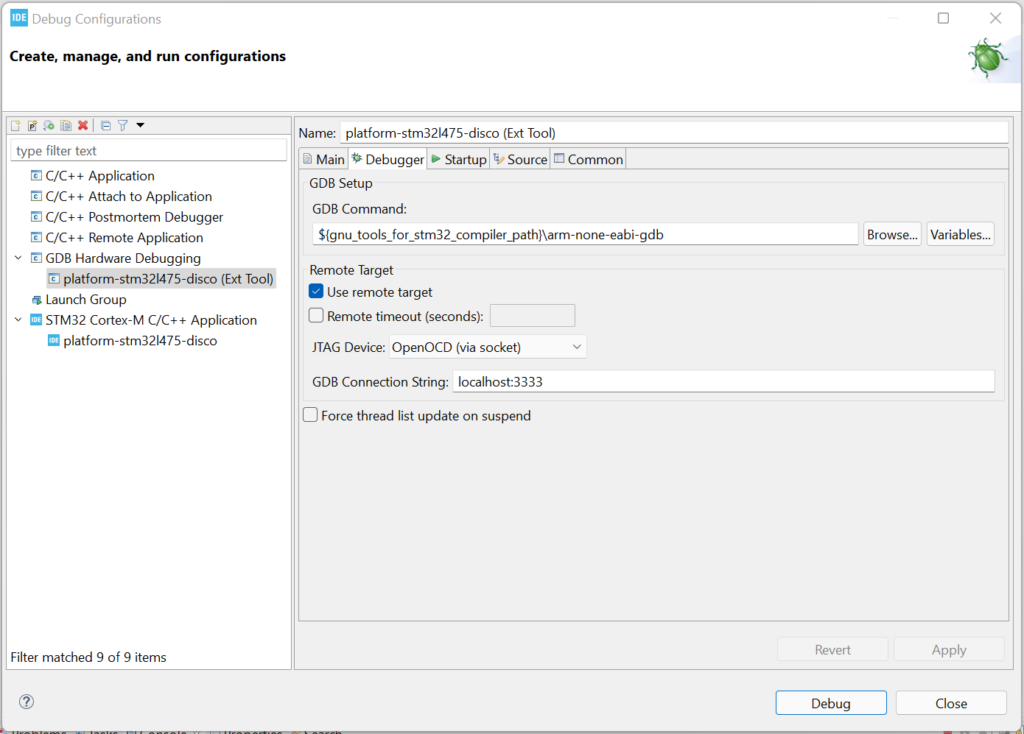
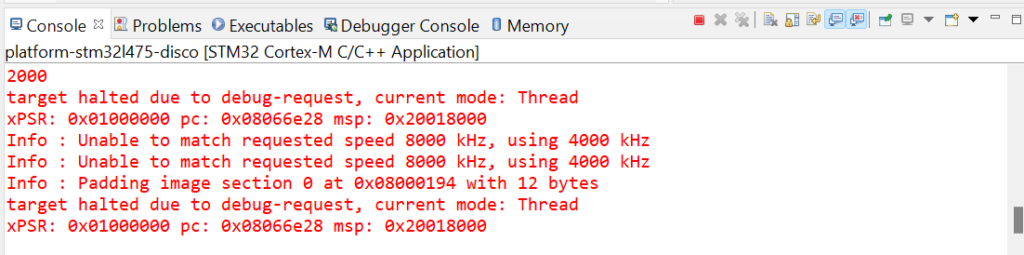
- Click the Debug button at the bottom-right corner to start debugging. Alternatively you may launch it via the favorite link named platform-stm32l475-disco (Ext Tool) at the top of the pull-down menu. When the program is downloaded and flashed successfully, you should see logs ending like these:
xPSR: 0x41000000 pc: 0x08015a9c msp: 0x20017f78
Info : Unable to match requested speed 500 kHz, using 480 kHz
Info : Unable to match requested speed 500 kHz, using 480 kHz
target halted due to debug-request, current mode: Thread
xPSR: 0x01000000 pc: 0x08066e28 msp: 0x20018000
2000
Info : Unable to match requested speed 500 kHz, using 480 kHz
Info : Unable to match requested speed 500 kHz, using 480 kHz
target halted due to debug-request, current mode: Thread
xPSR: 0x01000000 pc: 0x08066e28 msp: 0x20018000
Info : Padding image section 0 at 0x08000194 with 12 bytes
Info : Unable to match requested speed 500 kHz, using 480 kHz
Info : Unable to match requested speed 500 kHz, using 480 kHz
target halted due to debug-request, current mode: Thread
xPSR: 0x01000000 pc: 0x08066e28 msp: 0x20018000
- This method is less convenient as you would need to start OpenOCD manually prior to launching a debug session. However it may be faster since OpenOCD remains running in the background across multiple debug sessions.
- In some cases you may need to stop OpenOCD manually. For example, when you unplug the target board while Eclipse is still running, OpenOCD will lose its connection to the target and show an error message repeatedly. To stop OpenOCD, click the Red Stop button and the Double Cross button at the top-right corner of the console window.
Run and Debug
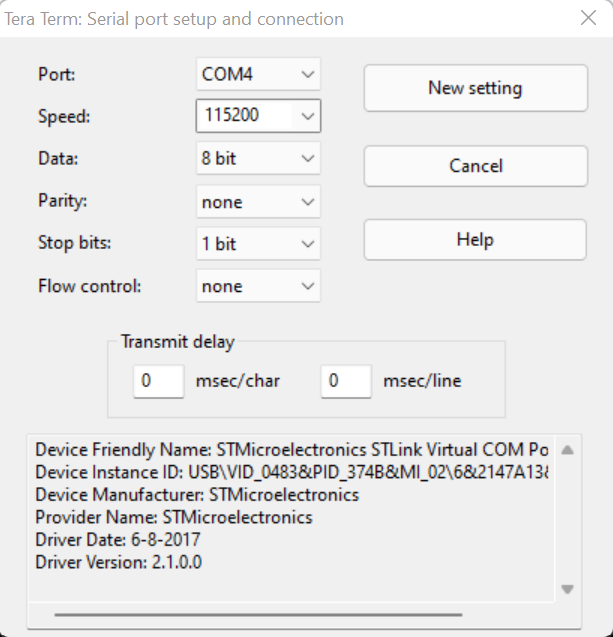
- Before running our program, you should first start a terminal program on Windows, such as teratherm. Select the COM port with the name “STMicroelectronics STLink Virtual COM Port”. Click Setup > Serial port… and configure the serial port to use 115200bps N81.
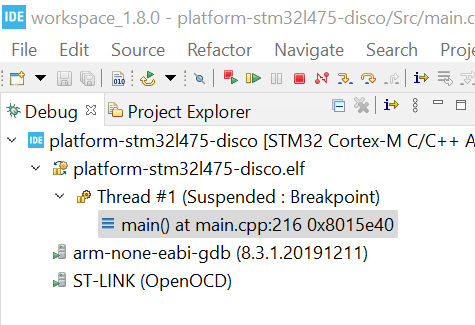
- The Debug window should show the program stopped at the beginning of main(). In the code window, it shows SystemClock_Config() since main() calls this function immediately:
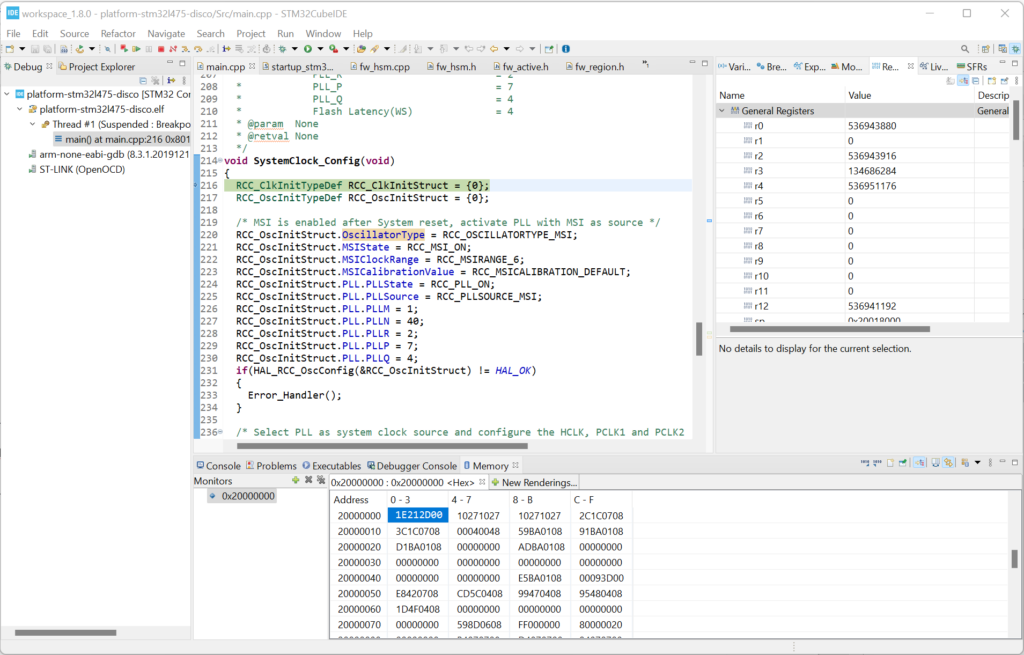
- The program control toolbar is at the top left corner. Run the program by clicking the green Play/Resume button. You may suspend/break the program at any time and step into/over/out of a function, etc. Like other debugger IDE, you can set up breakpoints, inspect registers, variables and memory.
- As the program is running on the target, you should see its debug log in the terminal program, which looks like this:
...
*******************************
*   Console STM32L475 Disco  *
*******************************
7 CONSOLE_UART1> 205 SYSTEM(1): Prestarting IDLE_CNT_TIMER
205 SYSTEM(1): maxIdleCnt = 7494000
205 SYSTEM(1): Prestarting EXIT
205 SYSTEM(1): Starting1 ENTRY
205 NODE(15): Stopped NODE_START_REQ from SYSTEM(1) seq=6
205 NODE(15): Stopped EXIT
205 NODE(15): Starting ENTRY
205 WIFI(14): Stopped WIFI_START_REQ from NODE(15) seq=0
206 WIFI(14): Stopped EXIT
206 WIFI(14): Starting ENTRY
206 WIFI(14): Starting DONE from WIFI(14) seq=0
206 WIFI(14): Starting EXIT
...
- You should be able to interact with the console. Try to enter the command “fib” and see what happens. Just hit enter again to stop the command.
- If you want to restart the program from the beginning (without downloading again), you may click the Restart button and select “Reset init” from the pull-down menu.
- When you are done with a debug session, click the red Stop/Terminate button to terminate the session. You can switch back to the C/C++ perspective by clicking its button at the top-right corner. You can then start a new code > build > debug cycle.


You May Also Like